One operational layer for every device in the facility.
Servers, GPUs, network fabric, UPS, PDUs, chillers and air handlers report into a single control plane, one alarm model, one telemetry pipeline, one API. Nine protocols, any vendor, fully managed or on your own infrastructure.
Your facility is converged. Your tooling is not.
Three device populations, three teams, three toolchains, and no shared model of what is actually happening. Every minute an operator spends correlating across consoles is a minute added to MTTR.
No unified alarm model
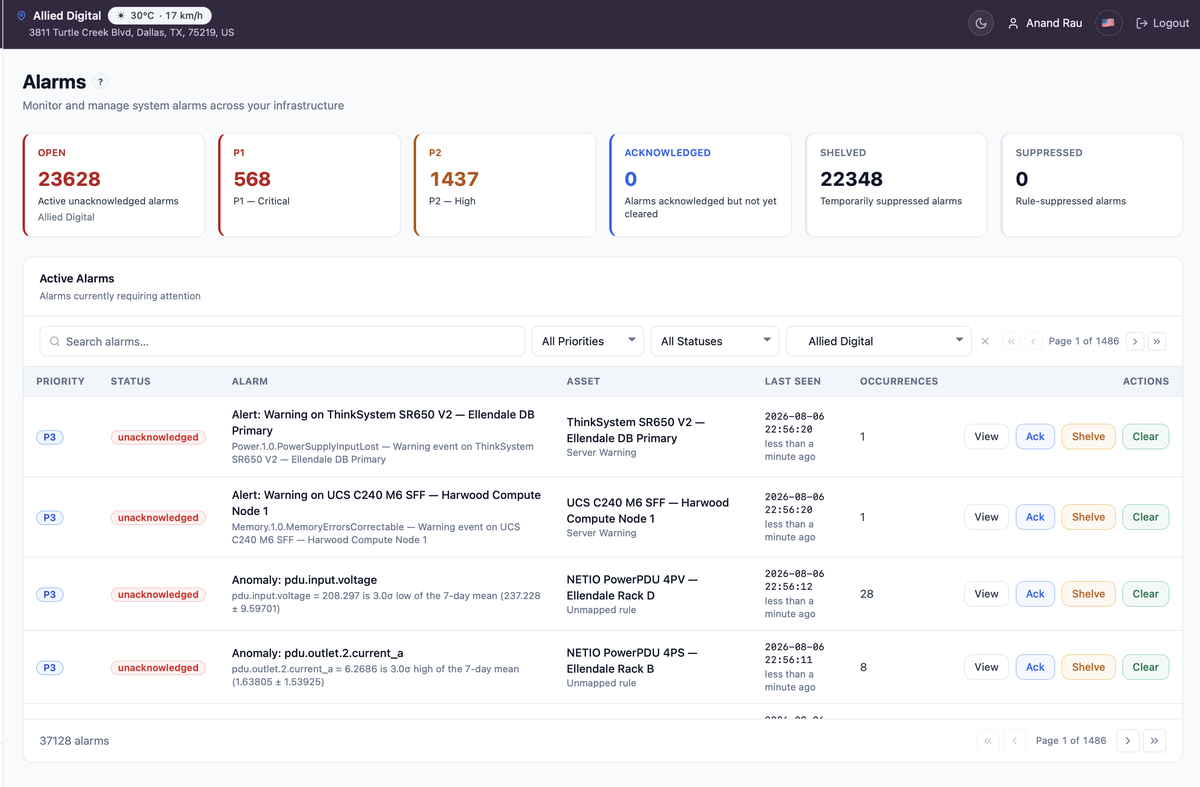
A UPS drops to bypass, the servers it feeds throttle, the top-of-rack BGP session flaps. Three tools, three unrelated alerts. The causal chain, power, compute, network, is invisible.
Alert fatigue without lifecycle
Threshold alerts with no acknowledgement state, no deduplication window, no escalation policy and no accountability trail. Operators triage duplicates instead of incidents.
Vendor lock-in as management
Each OEM manages its own hardware and no one else's. Fleet-wide operations become the intersection of what your vendors agree to expose.
Multi-tenancy bolted on
Cage 14 must never see Cage 12. That guarantee belongs in the database query layer, not in a UI filter applied after the data has already been read.
No modern integration surface
SNMP traps and email do not feed an event-driven operations pipeline. Streams, signed webhooks and API keys are table stakes everywhere else in your stack.
Four layers. Every consumer reads platform state, never the device.
The control plane absorbs polling, protocol translation, session management, deduplication and authentication. The UI, an API client, a Kafka consumer and an automation pipeline all read the same authoritative record.
Three numbers your board already tracks.
Correlation stops being manual
Cascade suppression walks the asset relationship graph: a UPS offline alarm suppresses the downstream server alarms it caused. Root-cause grouping clusters alarms inside a 60-second window. Operators see one incident, not forty symptoms.
One platform replaces the console sprawl
Register maps, OID maps, topic maps, BACnet point maps and gNMI path maps are configured once at the product-family level and inherited by every device of that type. Bulk import onboards fleets from a spreadsheet with fuzzy catalog matching instead of manual entry.
Every action is on the record
Every acknowledgement, shelve and clear is logged with timestamp and operator identity. Every write operation carries a before/after diff, actor and source IP, retained indefinitely, the SLA audit trail and the compliance evidence are the same artifact.
From the BMC to the chiller plant to the network fabric.
Full topology discovery, thermal and power telemetry, chassis control and event subscriptions across iLO, iDRAC, XCC, CIMC, iRMC, OpenBMC and any Redfish-compliant BMC.
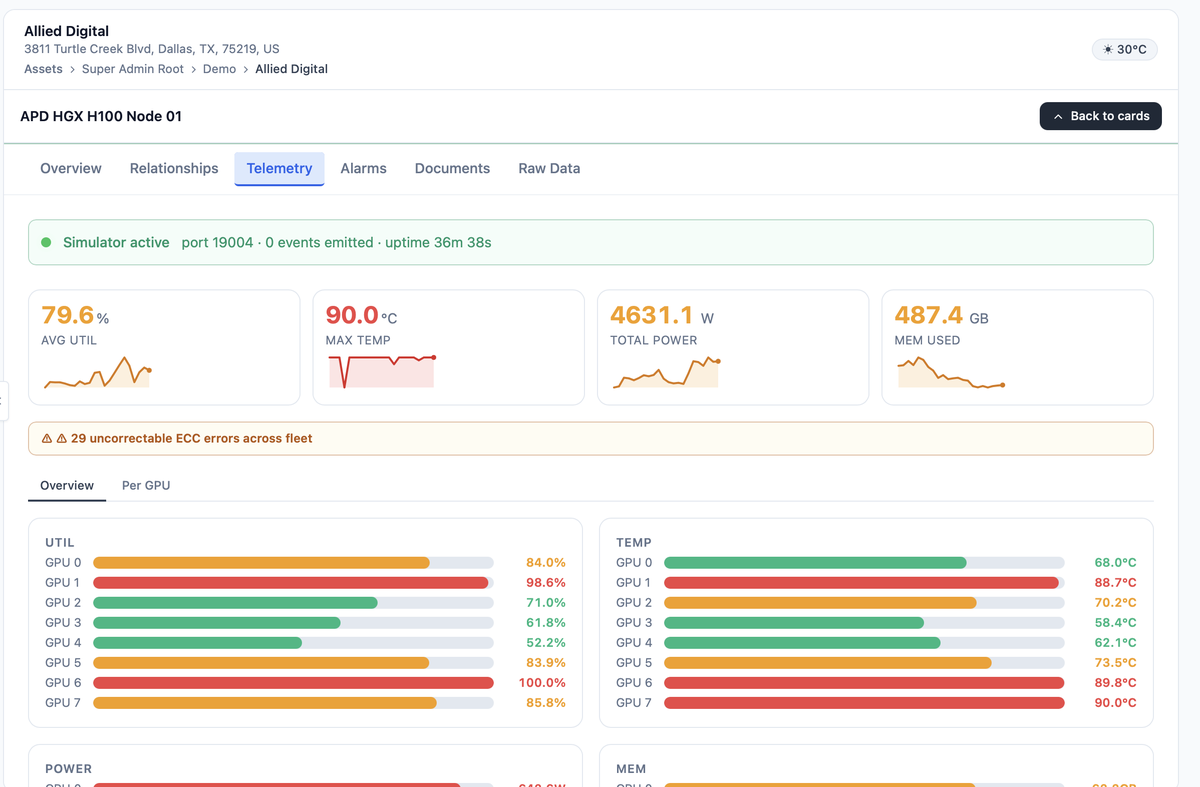
Per-GPU temperature, power, utilization, ECC, NVLink and PCIe throughput from any dcgm-exporter, joined to scheduler state so training runs no longer read as anomalies.
OpenConfig streaming telemetry, interface counters, BGP session state, optical TX/RX and OSNR, across IOS XR, NX-OS, Junos, EOS, SR-OS and optical transport.
UPS, PDUs, generators, power meters, CRAC/CRAH, chillers, AHUs and VAV boxes, batched register reads, wildcard topic ingestion and ASHRAE 135 point maps with write commands.
A tenth protocol does not require a release. Protocol Packs bundle a driver, a config schema and UI hints; they are uploaded, hot-registered into the live registry and versioned, with rollback, without a redeploy.
Built for a room that never closes.
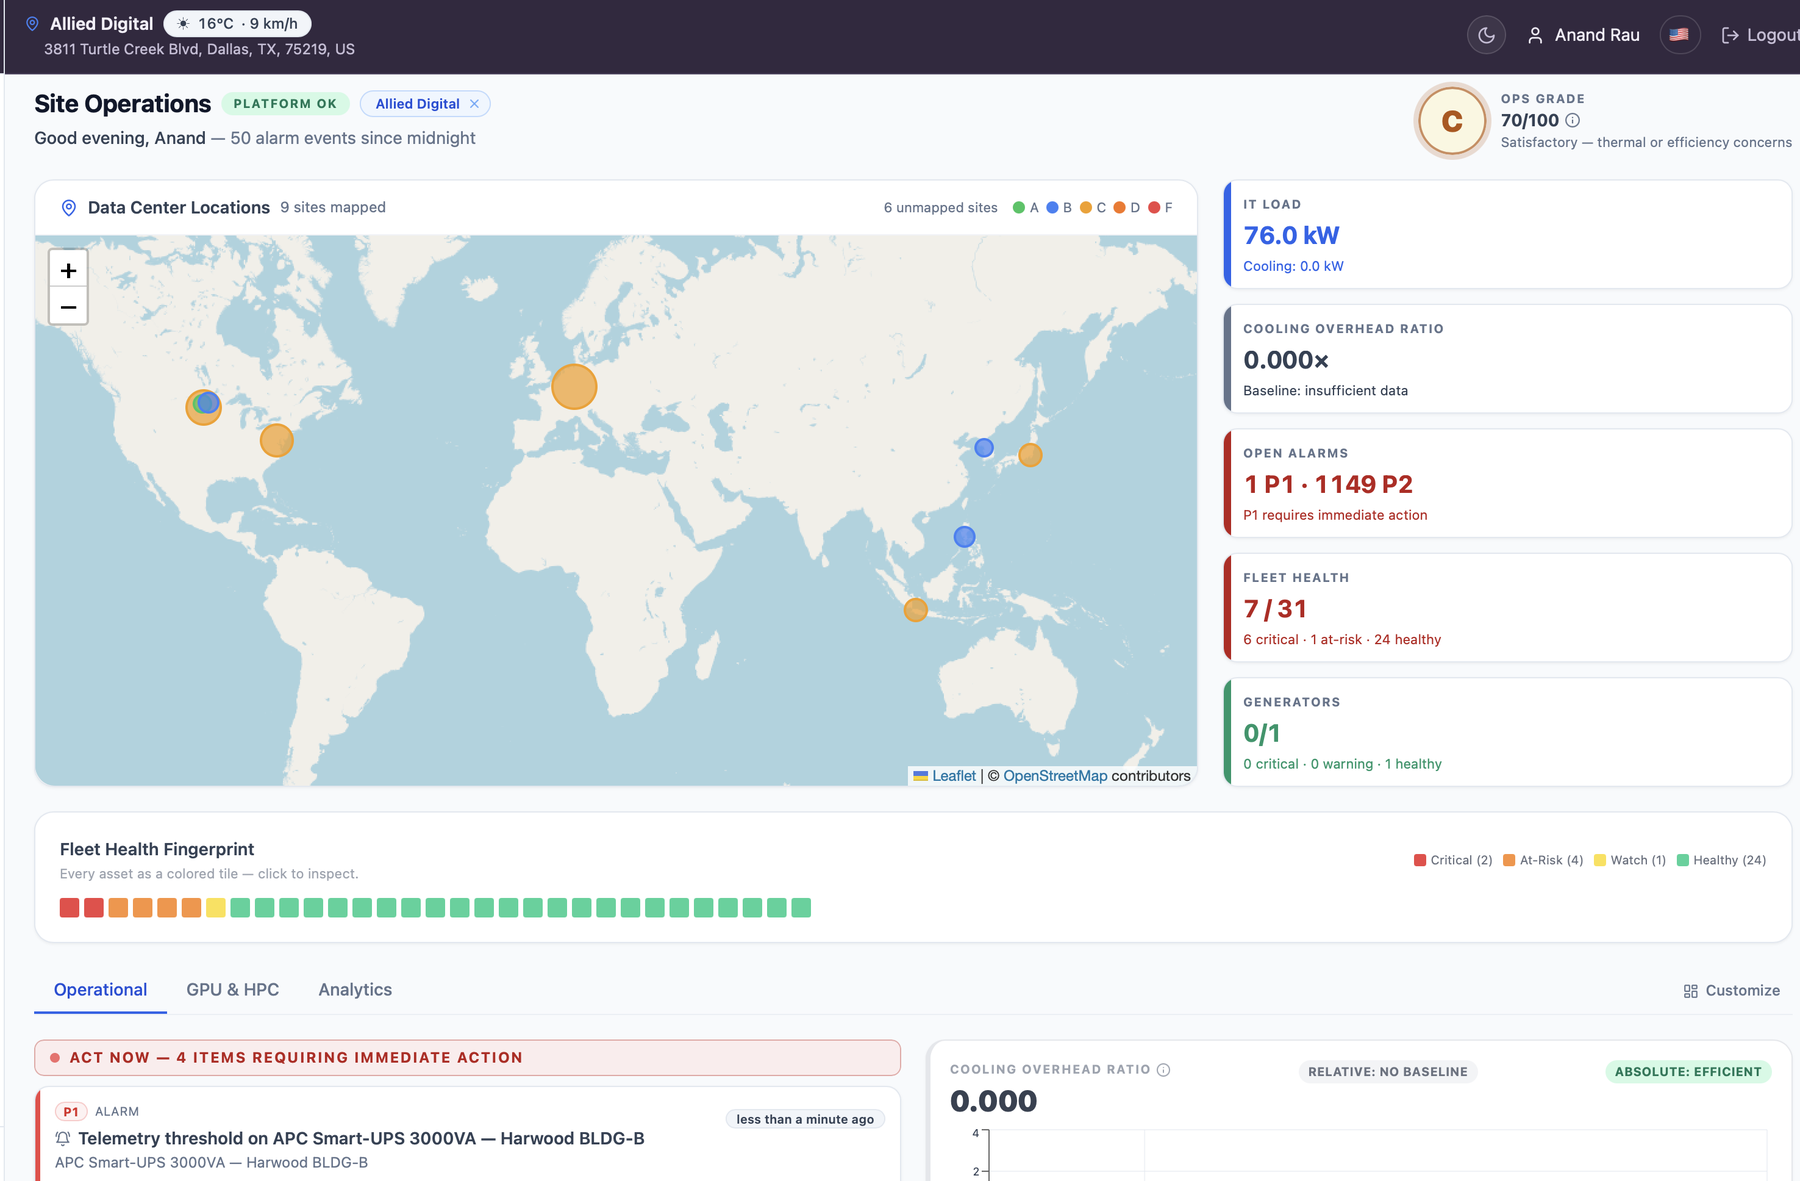
Eighteen pages purpose-built for 24/7 NOC use, internationalized in four locales. Act Now and Watch feeds rank incidents by urgency. A geographic map carries per-account health and alarm-storm rings. GPU and HPC intelligence sits on its own configurable board, including PTLA, a composite thermal-risk score for GPU racks.
Power density is rising faster than the tooling that watches it.
Per rack for GPU and AI accelerator deployments, against an average of 17 kW for traditional compute.
CAGR for AI-capable data center capacity through 2030; total capacity grows at 14%.
DCIM market in 2025, growing 10–18% a year, and still without a converged control layer.
Colocation market in 2025 at 14–18% CAGR, the segment where multi-tenant governance decides the deal.
Market data: Mordor Intelligence, MarketsandMarkets, Grand View Research, Precedence Research, Fortune Business Insights, McKinsey.
Four operating models, one platform.
Per-tenant isolation enforced in the query layer, per-cage metering, alarm history as SLA proof.
An account tree that mirrors your client topology, with API keys and webhooks for your automation.
GPU telemetry joined to scheduler state, ECC faults as P1, and thermal risk scored ahead of the event.
Vendor-neutral across every OEM you own, deployable on-premises where sovereignty requires it.
We do not ask you to take the architecture on faith.
The platform is operational software, not a diagram. It is standards-aligned where standards exist, and its behavior is pinned by an automated test suite and deterministic schema migrations.
Run a 30-day proof of concept against your own fleet.
All nine protocols can be demonstrated with the built-in simulators, then pointed at your real inventory. Bring your NOC leads, the alarm discipline is the part they will judge.
info@silverridge-group.com