The operational state layer above your hardware.
Not a monitoring tool. The authoritative record of what every device is doing, which alarms are open and in what lifecycle state, who owns what, and which commands were issued, by whom, and when.
Nine protocols. One telemetry pipeline. No exceptions.
Every driver writes through the same store_samples() path into a TimescaleDB hypertable. There is no protocol-specific alarm path and no protocol-specific telemetry endpoint, a GPU node, a Modbus UPS and an OpenConfig router are read the same way.
Servers, blades, storage, BMCs, liquid cooling
GPU nodes, clusters, job schedulers
Routers, switches, optical transport
UPS, PDUs, cooling, generators, HVAC
Read is uniform
/api/v1/assets/{slug}/telemetry returns the same shape whether the metrics came from OpenConfig paths, BMC sensors, Modbus registers, HVAC points, OID maps, DCGM fields or SLURM cluster counters.
Write is explicit
Control is protocol-specific by design, command semantics differ too much to flatten. Each protocol exposes its own discovery and execution endpoints; SNMP, DCGM and SLURM are telemetry-only and their control surfaces are hidden entirely.
Process-control alarm discipline, applied to the data center.
ISA-18.2 is the standard that industrial process control uses to keep operators effective under load. An alarm is not a notification, it is a record with a lifecycle, an owner and a history.
Every transition is written to the alarm's action history with a timestamp and an operator identity. Shelving is time-bounded or indefinite and always attributable. Suppression is derived from the typed asset relationship graph, so a UPS offline alarm silences the servers on that circuit rather than burying the operator in consequences.
Where alarms come from
Noise control that is built in
Escalation and accountability
Statistical detection without an ML pipeline to operate.
Z-score anomaly detection
No model training, no feature store, no external inference service. The computation runs inside the platform process against the telemetry it already holds.
Asset health score
Every asset carries a 0–100 score and a letter grade, sortable in the inventory and aggregated per account on the geographic map.
| Component | Max penalty |
|---|---|
| Active alarm burden (P1×20, P2×10, P3×5, P4×2) | 50 |
| Open anomaly alarms (10 each) | 30 |
| Telemetry availability gap over 24h | 20 |
| Peer percentile against same-type assets | 15 |
Healthy
Monitor
Investigate
Act
Critical
Analytics that answer operational questions, not dashboard questions.
Regression trend on any metric over a 1–365 day lookback, projecting time to threshold for battery degradation, bearing wear and capacitor aging.
A PUE proxy from IT power against facility power, baseline versus current, with configurable buckets.
Identifies over-sensitive rules, those whose firings mostly end in a rapid clear or shelve, and proposes threshold or deadband changes.
Traverses the relationship graph to surface single points of failure, upstream equipment feeding many downstream assets.
A correlation matrix across temperature metrics that identifies thermally coupled assets you did not know were coupled.
Temporal clustering of alarms inside sixty-second windows, surfacing the likely cause from co-occurring patterns.
Where power changes predictably drive thermal events, so capacity decisions can be made per rack.
Supply and return variance against setpoint over a configurable window, the first sign of a plant losing ground.
Fuel trending and a readiness score from last test run, fuel level and coolant temperature.
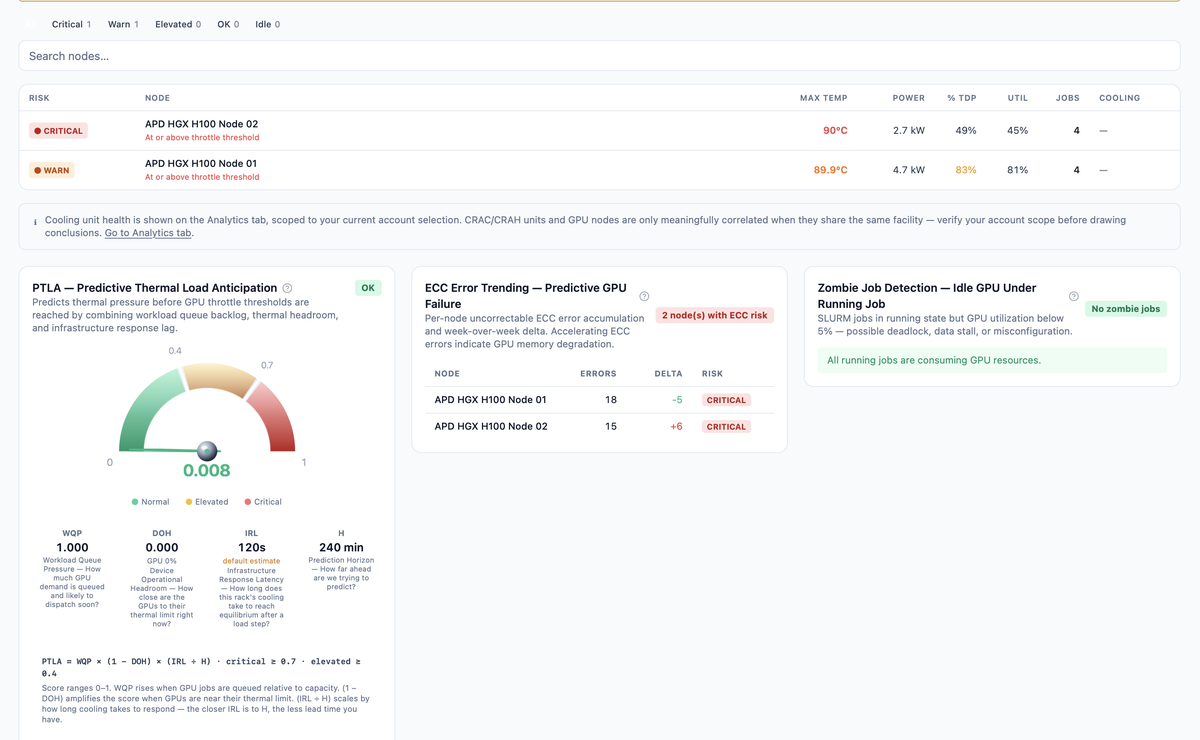
PTLA: thermal risk scored before the event, not after it.
Predicted Thermal Load Accumulation answers one question: how likely is this rack to hit a cooling-driven thermal event inside the prediction horizon? It combines what is queued, how much headroom the GPUs have left, and how slowly this rack's cooling actually responds.
A fleet arrives as a spreadsheet. It should not arrive as a data-entry project.
Upload, match, review, promote. Every promoted asset satisfies the catalog integrity constraints enforced in the database, so the registry stays clean at the point of entry rather than being cleaned up later.
Excel or CSV. More than fifty column header aliases are recognized per field; blank rows are dropped.
Manufacturer, model, asset type, protocol and full location path matched against the catalog with a confidence score.
Rows land as ready, needs review, awaiting catalog or error. Confidence is shown per field, not per row.
Override free text or pick from the catalog and location tree. A resolution propagates to every row with the same raw value.
Ready rows become live assets. The location's account determines ownership; unresolved catalog rows cannot pass.
Configure once, inherit everywhere
The catalog is a three-tier product hierarchy, and protocol maps inherit down it. Define a register map at the product family level and every device of that type picks it up, with per-device overrides still available for the exceptions.
Integrity enforced at the database
It has to fit the pipeline you already run.
Every state change, five ways out
| Channel | Typical consumer |
|---|---|
| Kafka topics | SIEM ingestion, observability, audit archival |
| Server-sent events | Live dashboards and wall displays |
| Signed webhooks (HMAC-SHA256) | ITSM and incident tooling, chat, custom endpoints |
| Redfish EventService | Existing Redfish-compliant management tools |
| REST polling | Scheduled reporting and audit pipelines |
Webhook delivery is tracked per event and per destination with retry, so an integration can be audited rather than assumed.
Two northbound APIs, not one
Which one you use depends on what you are integrating, and they cover different ground. See how they sit above the pipeline.
Deploy where your data has to live
Bring your NOC leads. The alarm discipline is what they will judge.
info@silverridge-group.com